

Want naughty book sales? Have a look at 2012. This, however, is all about the Noughtie/Naughties: those transformational years in terms of self-publishing and e-publishing, from 2000-2009.
In previous posts about book sales in the 1980s and 1990s, we saw that very few authors actually made it to #1 on the New York Times Bestseller List over the space of a whole decade. And once they got there, they tended to stay there for quite a long time. The vast majority of authors hung on to the top spot for considerably longer than 5 weeks.
So what happened in the 2000s? Well, I’ll tell you. For starters, I couldn’t even fit all the authors into one pie chart this time. I know! 2 Charts Instead of 1 Shocker! But that tells us just how much everything changed. More authors hit the #1 NYT Bestseller spot, and were knocked off within 1 or 2 weeks. The pie opened up. More authors got a piece. But less authors made an absolute fortune.
I’m going to be honest with you. This pie chart is, well, an unholy mess. It only holds half the data from the decade, unlike my other lovely pie charts, which could fit all 10 years’ worth of top bestsellers. But in the best traditions of the corporate world, I’m going to turn that negative into a positive and say it only serves to illustrate my ongoing point: that nowadays, more authors sell more books, because they have more opportunities to do so.
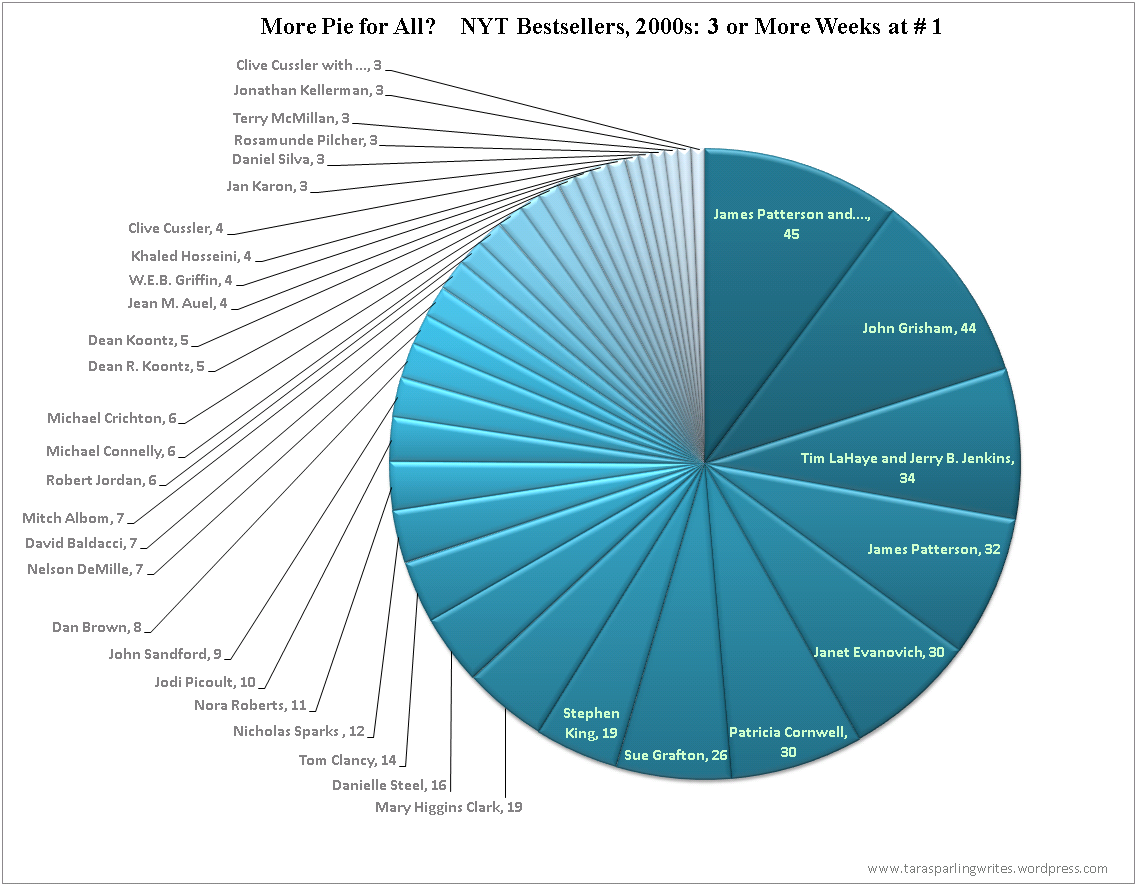
Only enough pie for authors who stayed at # 1 for more than 3 weeks. All the other poor authors are languishing in a spreadsheet
Let’s look at the most important statistics. To illustrate further (and make my inner nerd happier than a wasp in a raspberry jam coma) , let’s also compare them to those of the 1980s and 1990s.

First we see that there are simply more authors on the list: 78 in the ’00s, compared to 44 in the ’90s and 34 in the ’80s. The number of authors holding the # 1 spot for 5 weeks or more seems to be stable over the 3 decades, until you compare pie charts, and see that their length of time at the top shortened considerably. Far more authors hit #1 for only 1 or 2 weeks.
Big sellers in terms of volume only made #1 briefly in the 2000s, so the money was further down the top 10 or even 50. J.K. Rowling, despite massive crossover appeal, is classified as Children’s, so not included on the adult list. Other celebrated names only made the list for 1 or 2 weeks, such as Lee Child, John Irving, Ken Follett, Stephenie Meyer, Sophie Kinsella and Johnathan Franzen.
However, just like Grisham in the ’90s, there was an undisputed King of the Noughties: James Patterson, who managed a whopping 45 weeks at the top when co-writing with whoever he was churning them out with that month – let’s face it, quantity doesn’t mean quality – but also 32 weeks at the top when writing on his own. Combined, that means 77 weeks at the top. It doesn’t beat Grisham’s 83 in the 1990s, but it’s still hugely impressive, especially when we consider that so many authors were snapping at his heels in comparison with the ’80s and ’90s, when emerging authors were tethered to the plough of Publishing Giants, whipped at will with copies of their meagre-selling first-borns.
We’re going to have to move on to sales volumes next, to come up with invaluably shallow insights about what bestseller trends can tell us. And looking at the data, one thing is already clear. The data sucks. A huge proportion of new e-book sales aren’t even being counted, based on the price they were sold for. It might sound like a cop-out – because it is. Just because data is fragmented, doesn’t mean it’s irrelevant. But sadly, it’s all we’ve got.

2 comments for “Naughtie Book Sales (and no. It’s not what you’re thinking)”